


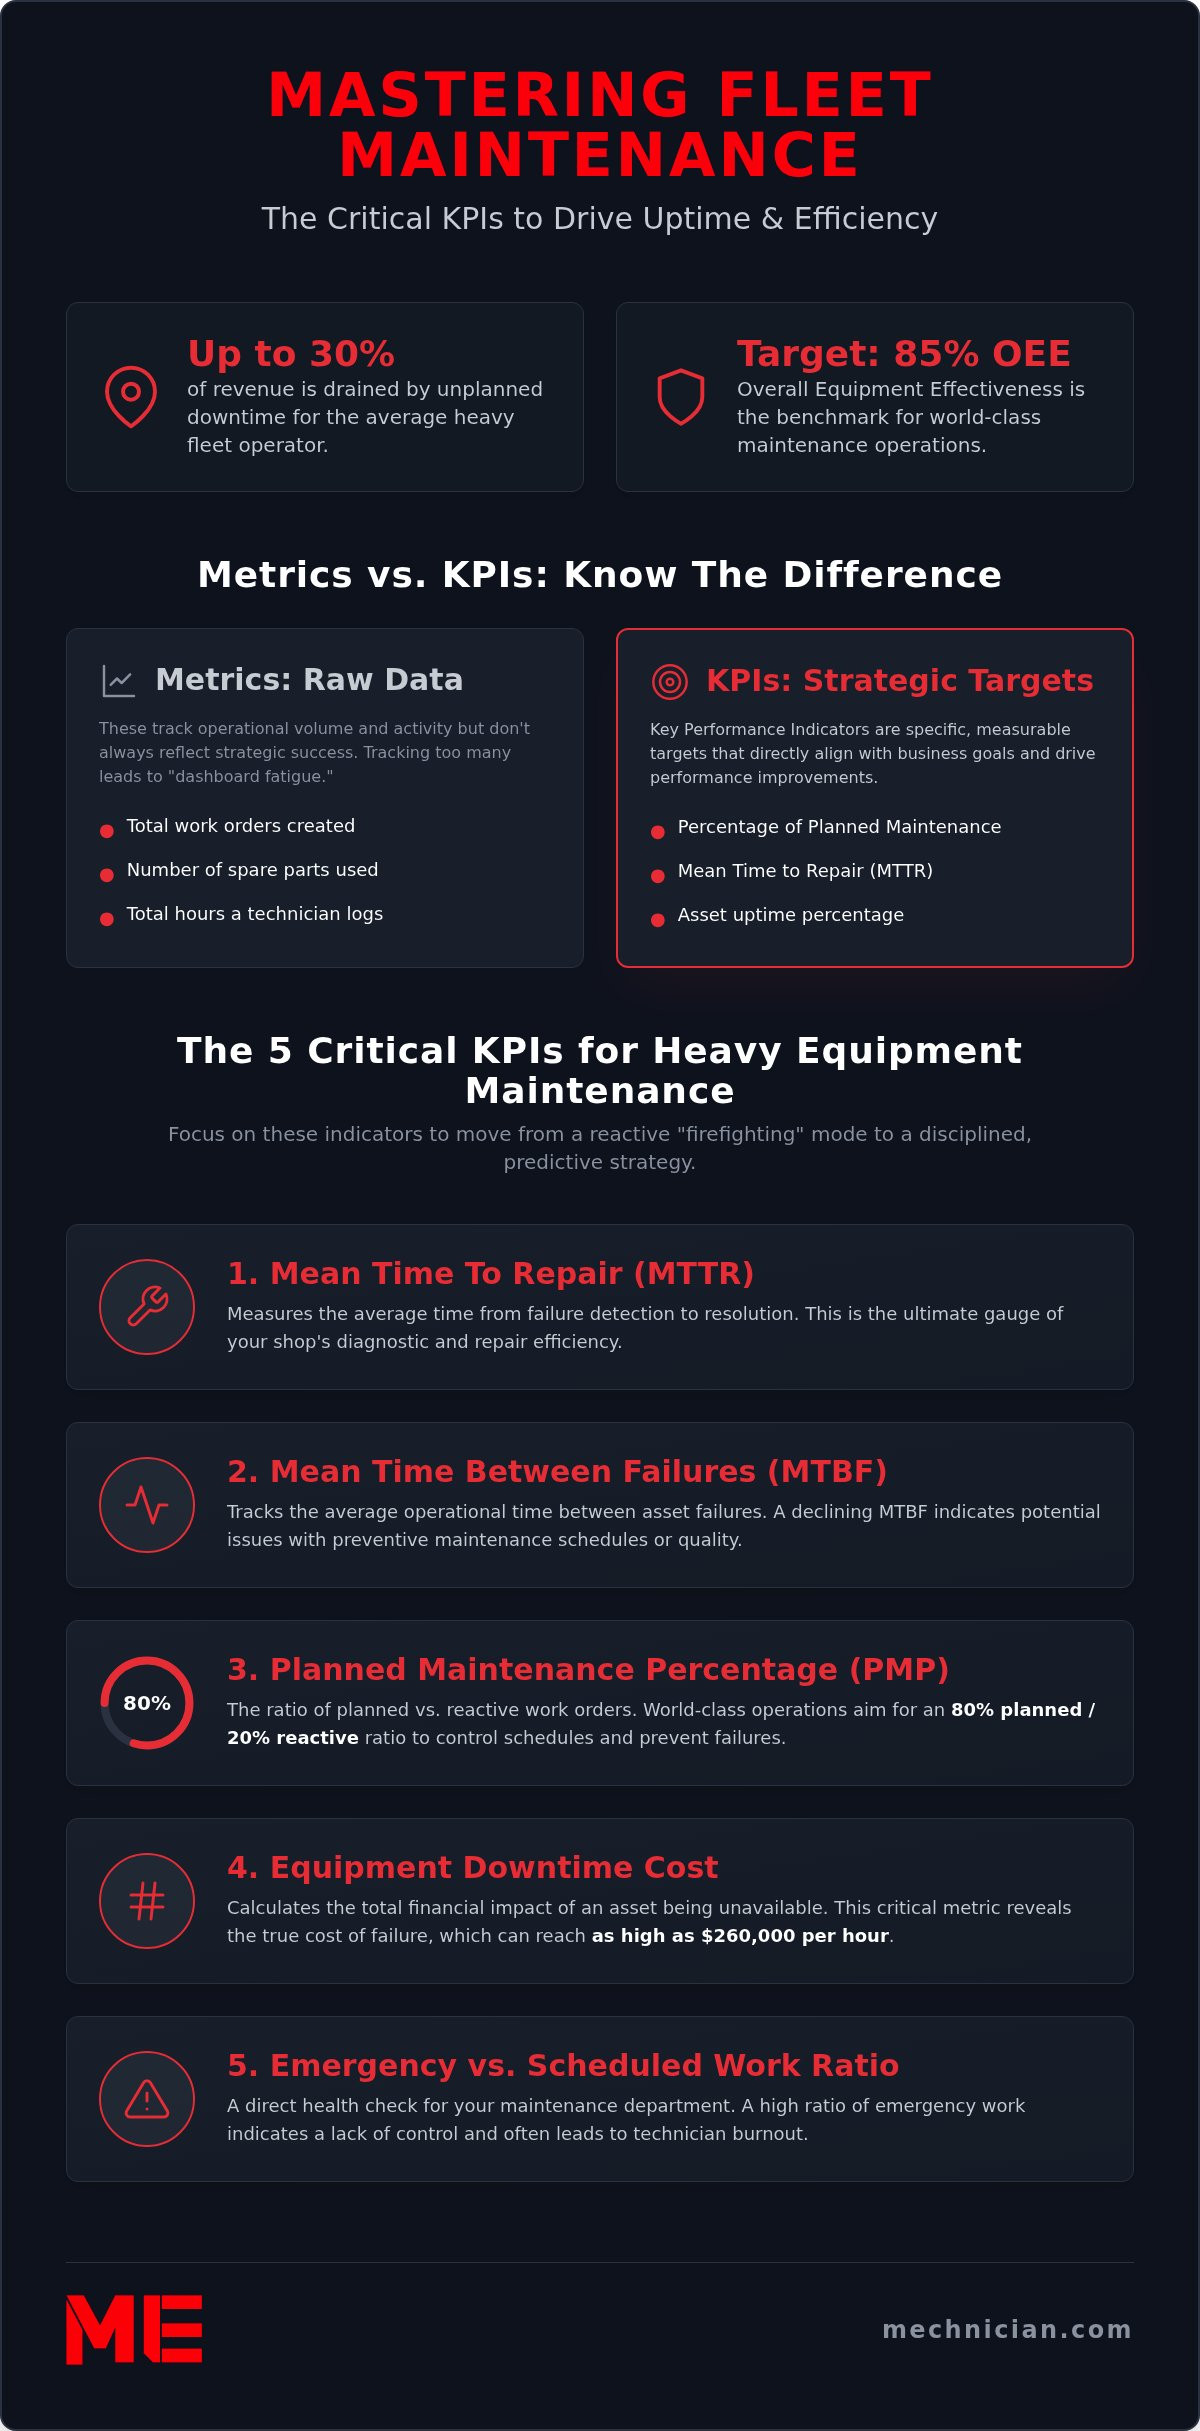
Did you know that unplanned downtime is currently draining up to 30% of revenue for the average heavy fleet operator? It's a staggering figure, especially when you're still fighting with manual logbooks and waiting for expensive dealer diagnostics. You're likely tired of the reactive cycle where repairs happen too late and costs are impossible to justify. Building a robust equipment maintenance KPI dashboard isn't just about pretty charts; it's about gaining the technical precision needed to keep your assets in the field.
We understand that a fleet manager's priority is operational stability and safety. In this guide, we'll provide a clear framework to help you master the metrics that matter most in 2026. You'll learn how to construct a diagnostic-driven dashboard that slashes downtime and optimizes shop efficiency. We'll explore how to reduce your Mean Time to Repair (MTTR) and reach the 85% OEE benchmark that defines world-class maintenance operations. By the end, you'll have a professional reporting structure ready for your next quarterly review.
Key Takeaways
- Distinguish between raw data metrics and strategic KPIs to ensure your reporting drives measurable fleet performance improvements.
- Build an equipment maintenance KPI dashboard that prioritizes "North Star" metrics like Mean Time to Repair (MTTR) to directly reduce unplanned downtime.
- Learn a five-step architecture for designing a dashboard that integrates real-time ECU data and telematics for maximum diagnostic accuracy.
- Understand how professional diagnostic tools like the Jaltest CV Kit eliminate data gaps by providing granular insights into asset health.
- Discover how to leverage specialized technical support to maintain your dashboard targets and foster a sustainable, data-driven maintenance culture.
What is an Equipment Maintenance KPI Dashboard?
An equipment maintenance KPI dashboard is a centralized visual interface designed to track the critical health and performance metrics of a heavy equipment fleet. It functions as a diagnostic command center, pulling data from various sources to provide a real-time overview of operational readiness. For fleet managers in 2026, this tool has transitioned from a luxury to a necessity. Manual entry is no longer sufficient; the complexity of modern machinery requires direct integration with vehicle systems to eliminate human error and data gaps.
Effective fleet management relies on the 'Downtime Triangle'. This concept describes the constant tension between repair costs, service speed, and asset reliability. Without a professional equipment maintenance KPI dashboard, managers often make blind choices that sacrifice long-term reliability for short-term cost savings. By visualizing these three factors simultaneously, you can make data-driven decisions that protect your bottom line while ensuring your machines stay on the job site. This engineering-led approach replaces guesswork with technical certainty.
Maintenance Metrics vs. KPIs: Knowing the Difference
It's easy to confuse raw data with strategic insights. Metrics track almost everything in your shop, from the number of oil filters used to the total hours a technician spends on a machine. While this data is useful for inventory, it doesn't necessarily tell you if your maintenance strategy is succeeding. KPIs, or Key Performance Indicators, are the specific targets that move the needle for your business and align with your operational goals.
Consider the difference between 'Total Work Orders' and the 'Percentage of Planned Maintenance'. The first is a metric that describes volume; the second is a KPI that describes the health of your preventive program. If your total work orders are high but your planned maintenance percentage is low, your team is likely stuck in a reactive cycle. Tracking too many metrics leads to dashboard fatigue, where important signals are lost in a sea of irrelevant noise. Focus on the indicators that directly influence your fleet’s uptime and safety.
The ROI of Visualizing Fleet Health
A well-maintained dashboard offers significant financial advantages beyond simple organization. It allows you to identify 'lemon' assets, those specific machines that consistently underperform or require excessive repairs compared to the rest of the fleet. Identifying these outliers early enables you to retire or replace them before they cause a catastrophic failure in the middle of a critical project. This proactive stance is essential for maintaining long-term stability.
Digital transparency also enhances the residual value of your equipment. When it comes time to sell or trade in an asset, having a verified digital history of every diagnostic check and preventive service provides confidence to the buyer. This level of professional record-keeping can even be used to negotiate more favorable insurance premiums, as it proves a commitment to risk mitigation. Reducing unplanned downtime by 10% can recover thousands of dollars in lost operational revenue and prevent cascading project delays.
The 5 Critical KPIs for Heavy Equipment Maintenance
A professional equipment maintenance KPI dashboard must go beyond simple uptime tracking. To achieve true operational stability, you need to monitor the specific variables that influence your bottom line. In 2026, top-tier maintenance departments focus on five core indicators to evaluate their health. These metrics provide the technical precision required to move from a reactive "firefighting" mode to a disciplined, predictive strategy.
- Mean Time to Repair (MTTR): This measures the average time required to troubleshoot and fix a failure. It is the ultimate gauge of your shop's diagnostic efficiency.
- Mean Time Between Failures (MTBF): This tracks the reliability of your assets. A declining MTBF suggests your preventive maintenance (PM) intervals are either too far apart or being performed incorrectly.
- Planned Maintenance Percentage (PMP): World-class operations aim for a ratio of 80% planned work to 20% reactive work. If your PMP is below 50%, your schedule is likely being dictated by equipment failures rather than your team.
- Equipment Downtime: This calculates the total hours an asset is unavailable. In some industrial sectors, the hourly cost of unplanned downtime can reach as high as $260,000, making this a critical financial metric.
- Emergency vs. Scheduled Work Ratio: This is a health check for your department. A high emergency ratio indicates a lack of control over asset health and often leads to technician burnout.
Deep Dive: Mean Time to Repair (MTTR)
MTTR is often misunderstood as just the time spent turning a wrench. In reality, it consists of three distinct phases: diagnosis time, active repair time, and testing time. For heavy equipment, diagnosis is frequently the longest phase. Waiting for a dealer technician or struggling with limited fault code information can extend downtime by days. Using independent diagnostic tools, such as the Jaltest CV Kit, can slash diagnosis time by 50% by providing immediate ECU access. Setting realistic benchmarks for AGV and OHW sectors ensures your team isn't penalized for the inherent complexity of specialized machinery.
Overall Equipment Effectiveness (OEE) for Mobile Assets
OEE is a standard in manufacturing, but it requires adaptation for mobile assets like excavators or forklifts. For these machines, availability must account for transport and setup time. Performance is often measured by cycle times or fuel efficiency rather than units produced. One of the biggest threats to heavy equipment OEE is excessive idle time. An equipment maintenance KPI dashboard that tracks idling helps identify operator behavior or logistical bottlenecks that waste fuel and accelerate engine wear without adding value. Aiming for an OEE benchmark of 85% puts your fleet in the "world-class" category of modern maintenance.
Architecture of a High-Impact Dashboard: 5 Steps to Design
Constructing an effective equipment maintenance KPI dashboard requires a structured approach similar to a complex mechanical assembly. You cannot simply display every available data point and expect clarity. A high-impact dashboard must be designed with a specific hierarchy of information that prioritizes actionable insights over raw volume. Following a disciplined five-step process ensures your reporting tool remains a functional asset rather than a digital distraction.
- Identify your 'North Star' metric: Start with your primary operational bottleneck. If unplanned downtime is currently your biggest revenue leak, every other chart on the dashboard should provide context for that single figure.
- Select your data sources: A reliable dashboard relies on three pillars: telematics for usage hours, CMMS for labor and parts history, and ECU diagnostic logs for real-time asset health.
- Choose appropriate visualization styles: Use bar charts to compare performance between different machine models. Line graphs are ideal for identifying trends in reliability, while gauges provide an immediate status check against specific monthly targets.
- Define user roles: A shop technician needs a view of active fault codes and upcoming PM tasks. Conversely, a CFO requires a high-level summary of the cost per operating hour and total maintenance spend.
- Establish a 'Data Hygiene' protocol: Automated data is best, but for manual inputs, you must implement a strict protocol. Inaccurate work order entries will quickly compromise the integrity of your entire reporting system.
Visualizing Leading vs. Lagging Indicators
To move toward a predictive maintenance culture, your dashboard must distinguish between what has happened and what is likely to occur. Lagging indicators, such as last month's total repair costs, are historical records. They're useful for budgeting but don't prevent failures. Leading indicators are the secret to proactive management. For example, tracking the number of active 'Stage 1' fault codes across your fleet provides a window into future maintenance needs. Addressing these minor alerts before they escalate into 'Stage 3' critical shutdowns is how you protect your revenue.
Integrating Diagnostic Data into your Dashboard
The most common failure point for an equipment maintenance KPI dashboard is a lack of granular technical data. Without direct ECU access, your dashboard is essentially guessing. Integrating diagnostic data allows you to create a 'High Risk' asset widget that automatically flags machines with recurring engine or hydraulic anomalies. The accuracy of this data stream depends heavily on the hardware interface used. Utilizing specialized diagnostic cables ensures a stable connection between the machine and your reporting software. By automating the data flow from your Jaltest kit directly into your dashboard, you eliminate the delays and errors associated with manual logbooks.
The Diagnostic Edge: How Tools Like Jaltest Feed Your KPI Accuracy
Many managers encounter the 'Black Box' problem when building an equipment maintenance KPI dashboard. This occurs when the dashboard tracks administrative data, such as labor hours and parts costs, but lacks direct access to the engine control unit (ECU). Without this deep technical visibility, your dashboard is essentially blind to the actual health of the machine. You might see that a repair took four hours, but you won't know if three of those hours were spent guessing at a fault code. Accurate reporting requires a direct digital bridge between the machine's brain and your management software.
The Jaltest CV Kit provides the granular data necessary to transform your Mean Time to Repair (MTTR) from a vague estimate into a precise metric. By delivering immediate, dealer-level diagnostic information, it eliminates the "diagnostic gap" where technicians wait for external help. This in-house capability allows you to validate your Mean Time Between Failures (MTBF) by ensuring the root cause was addressed. If a machine returns to the shop for the same fault within 48 hours, your dashboard will flag it not just as a new repair, but as a failure of the initial diagnostic process.
Consider the impact on 'Dealer Waiting Time'. In many heavy equipment sectors, waiting for a dealer technician can ground an asset for days. By performing diagnostics in-house, you reclaim control over your schedule. This shift doesn't just lower costs; it provides the clean, reliable data your dashboard needs to reflect the true operational efficiency of your workshop.
All-Makes Diagnostics vs. OEM-Specific Tools
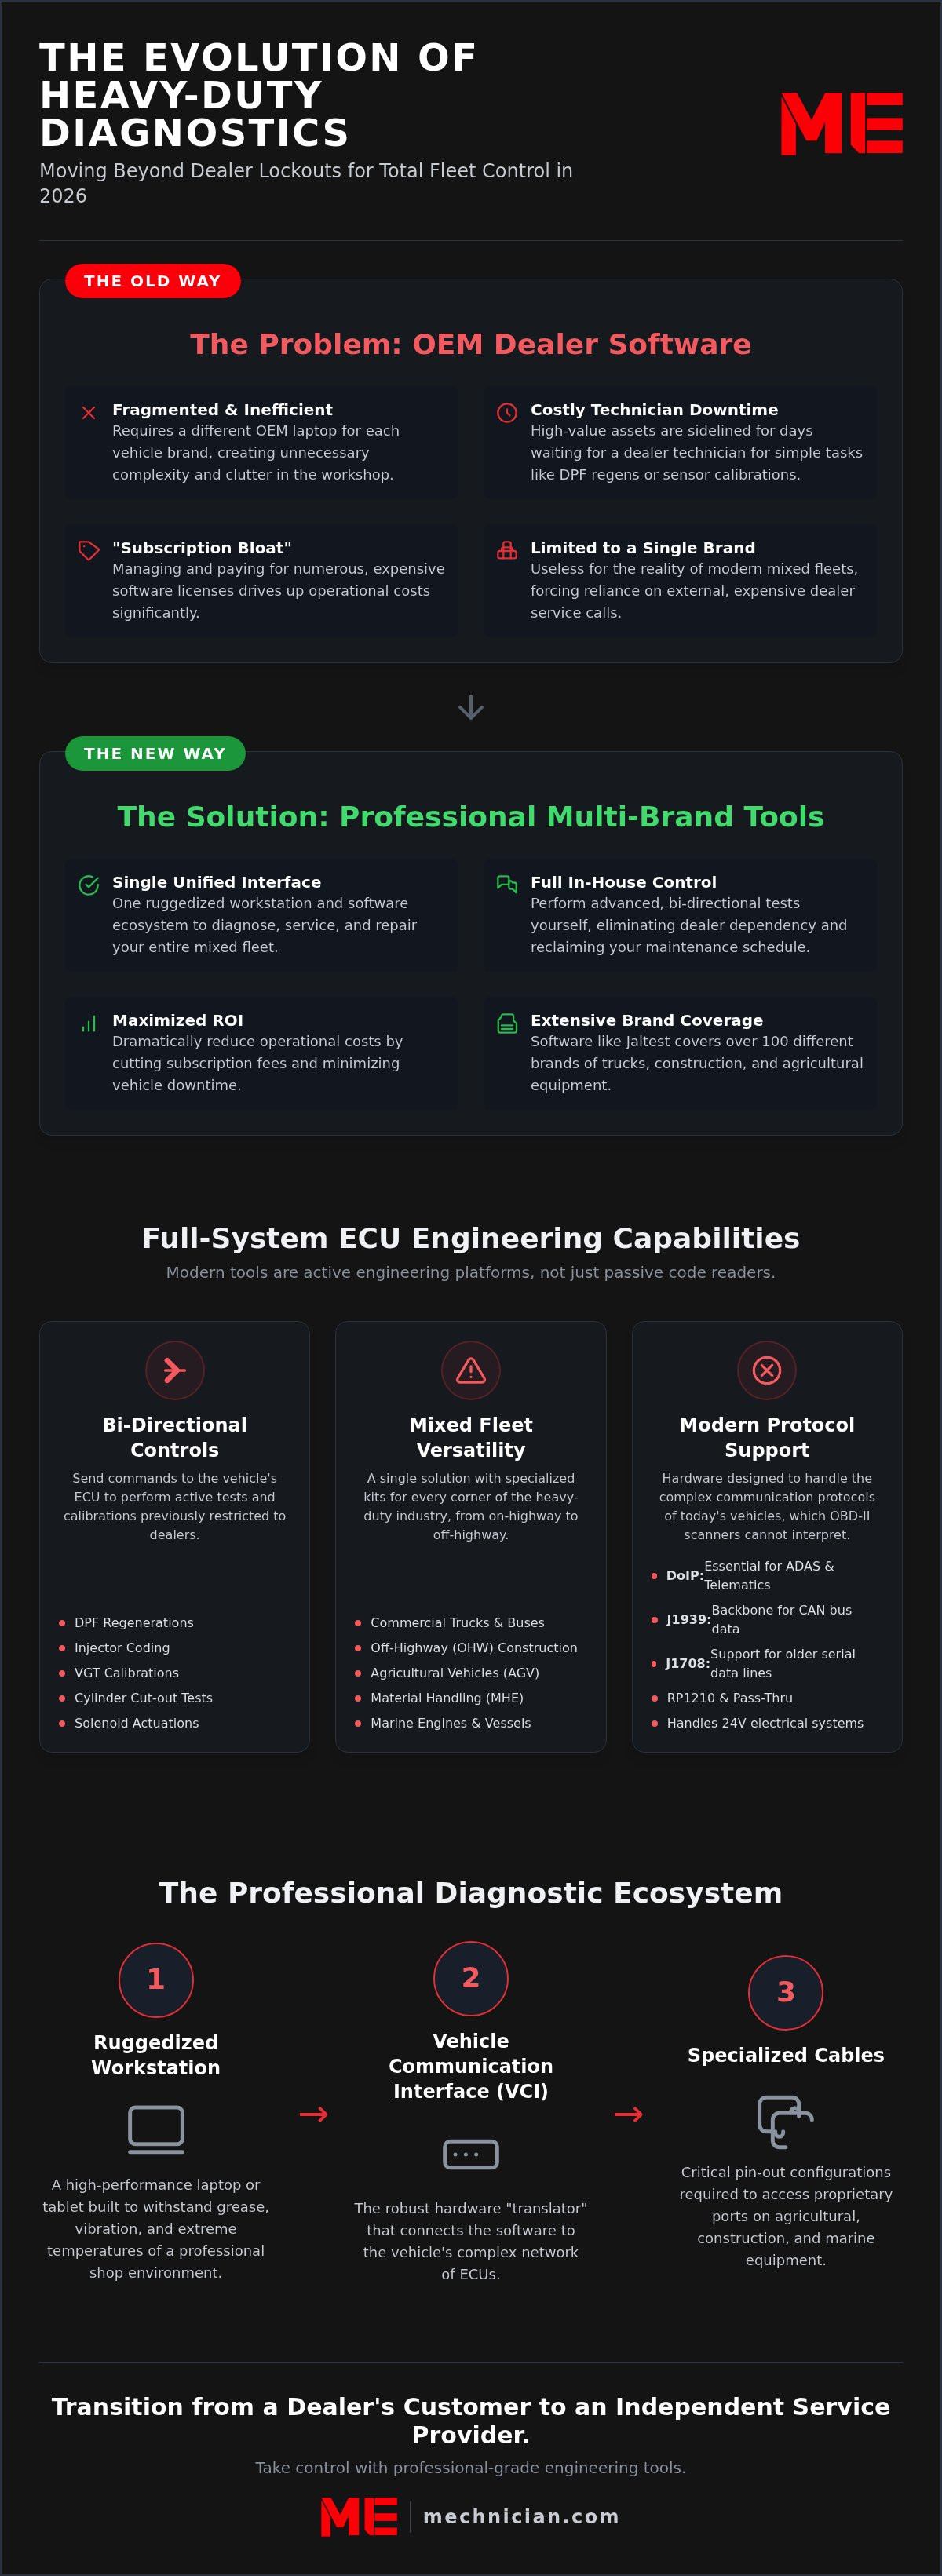
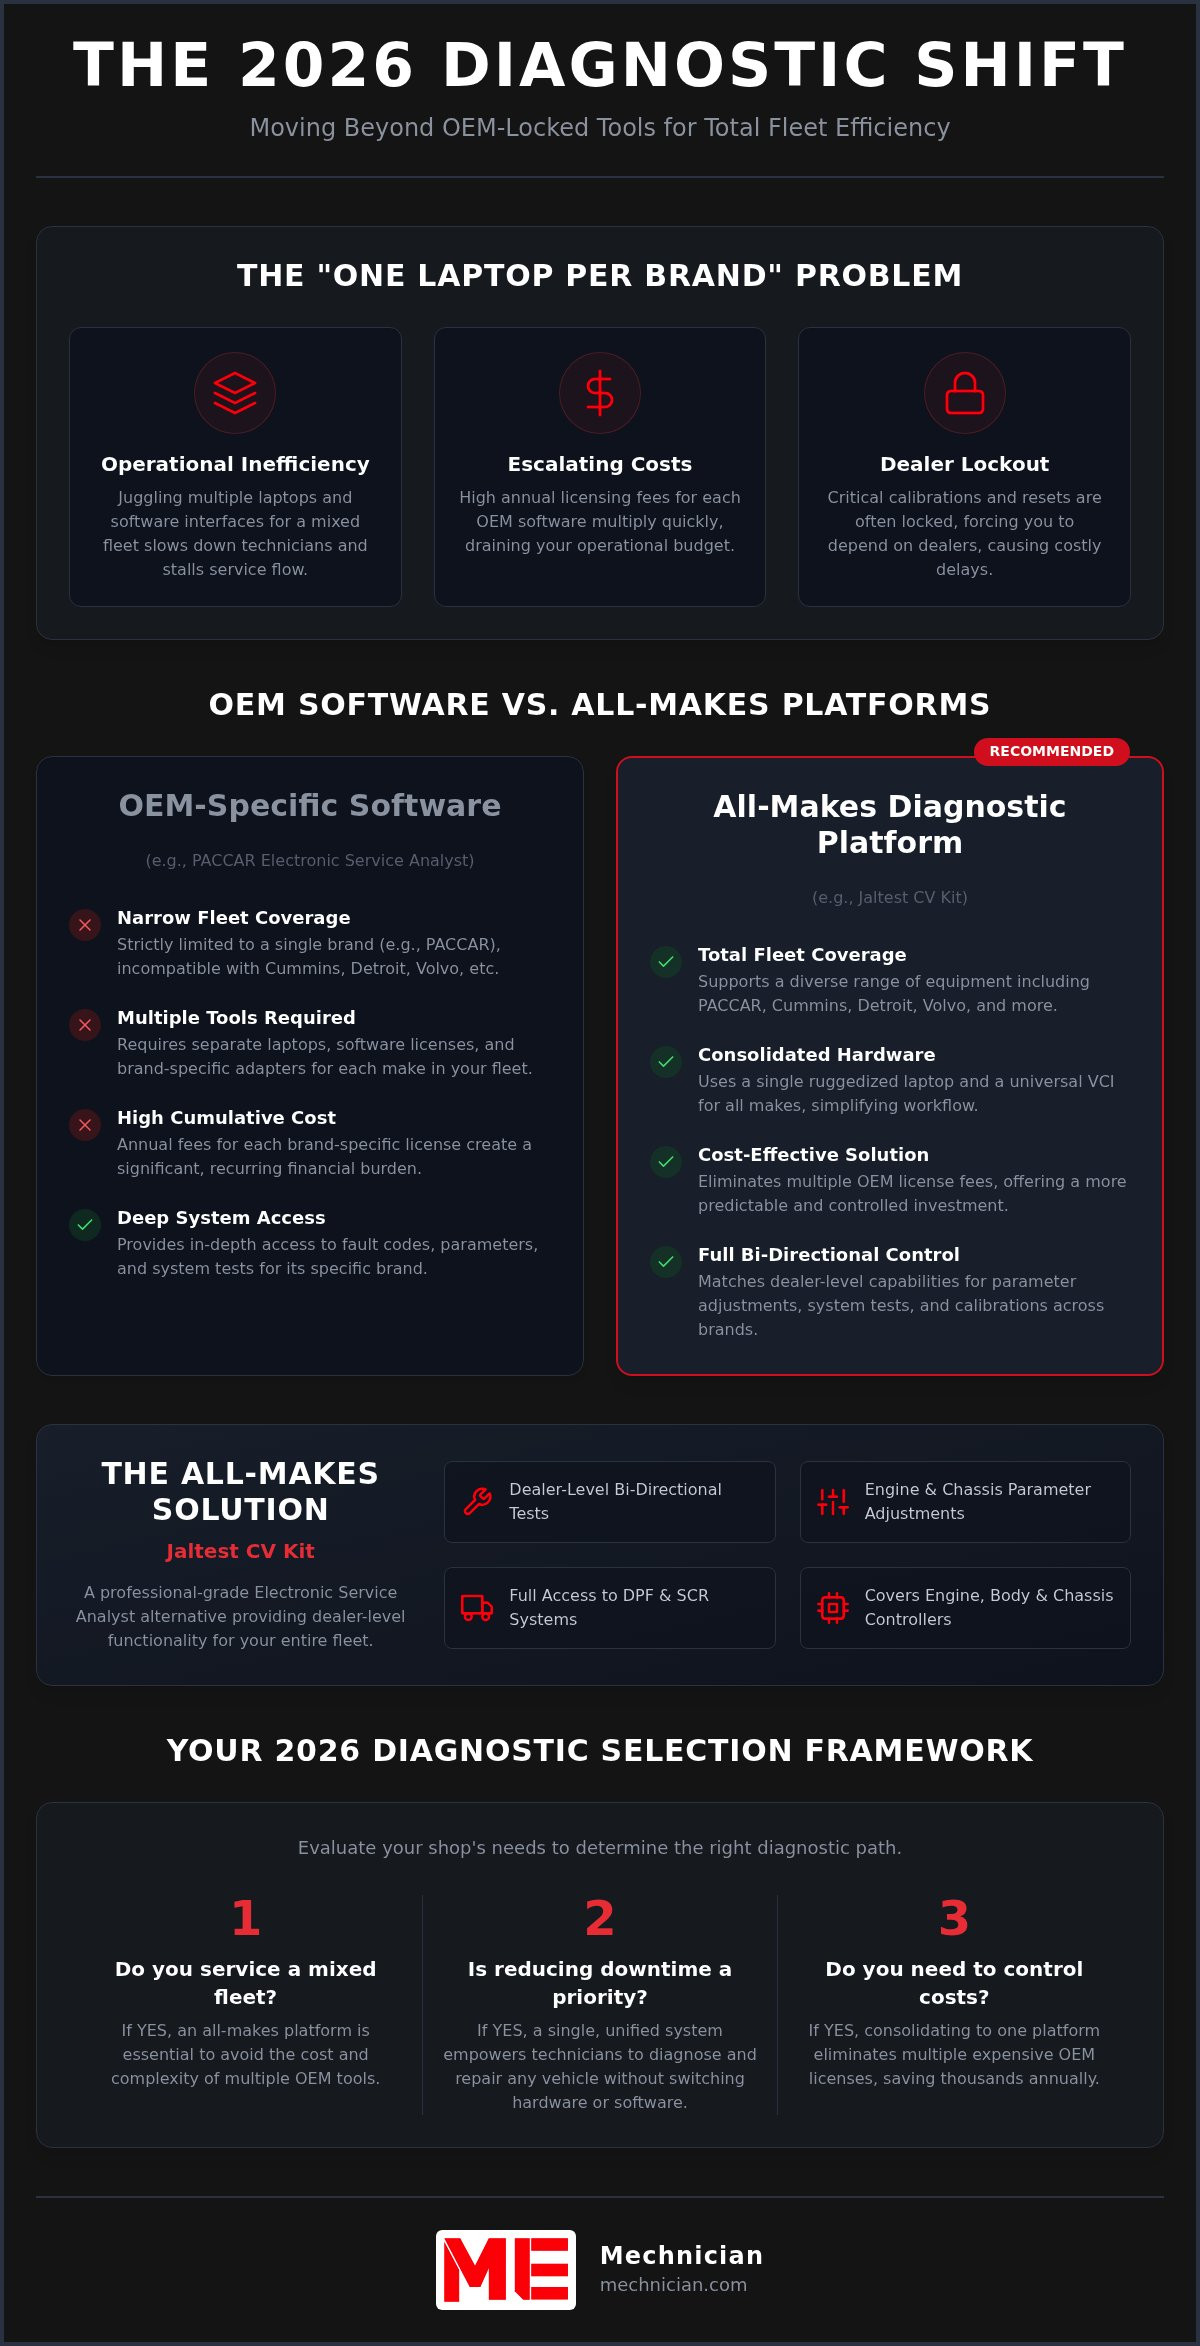
Managing a mixed fleet of CAT, John Deere, and Volvo equipment often leads to 'Tool Fragmentation'. Buying a separate diagnostic laptop for every brand is expensive and creates inconsistent data streams. A single, high-quality vehicle diagnostic tool standardizes your KPI data across all brands. This unified approach simplifies technician training, as your team only needs to master one interface to pull data for the entire fleet. It ensures that the information flowing into your equipment maintenance KPI dashboard is consistent, regardless of the machine's color.
From Reactive to Predictive: The Role of Fault Code Analysis
Predictive maintenance relies on the ability to track 'Ghost Codes' and intermittent faults that don't yet trigger a dashboard warning light. Jaltest OHW and AGV kits allow you to monitor these early warning signs and predict failures before the operator even notices a performance drop. For example, performing a 'Force Regen' or a sensor calibration during a scheduled service prevents an emergency shutdown later. These proactive technical interventions directly improve your 'Schedule Compliance' KPI by ensuring that maintenance happens on your terms rather than the machine's.
Ready to eliminate the diagnostic gap in your fleet? Explore our range of professional Jaltest diagnostic kits to start feeding your dashboard with the precision data it deserves.
Scaling Your Maintenance Strategy with Mechnician
Implementing an equipment maintenance KPI dashboard is a significant step toward operational maturity, but the tool is only as effective as the culture supporting it. Mechnician functions as a professional partner, helping fleet managers transition from traditional mechanical repairs to a disciplined, data-driven maintenance culture. We provide the technical infrastructure and expertise required to ensure your reporting reflects the reality of your shop floor. By integrating advanced diagnostics into your daily workflow, you turn raw data into a strategic asset that protects your fleet's long-term stability.
We recognize that the initial investment in high-level diagnostic technology can be a hurdle for some organizations. However, viewing these tools as a capital investment in operational safety rather than a simple expense changes the financial equation. Mechnician offers pathways to help you finance your diagnostic future, allowing you to overcome cost objections by demonstrating a clear return on investment through reduced downtime. The Jaltest ecosystem is a unified solution, combining specialized software, ruggedized diagnostic laptops, and specialized cables to ensure your team has everything they need to succeed from day one.
Beyond the Tool: Training and Support
Technical training serves as the primary multiplier for your equipment maintenance KPI dashboard. Even the most advanced software is useless if your technicians don't feel confident navigating the interface. By providing comprehensive Jaltest training, we help your team master complex procedures like parameter adjustments and system calibrations. This investment in your people also helps reduce technician churn. When skilled mechanics have access to world-class diagnostic technology, they spend less time frustrated by "ghost codes" and more time performing high-value repairs.
Mechnician's Jaltest technical support acts as a critical safety net for your Mean Time to Repair (MTTR) goals. If your team encounters a particularly stubborn fault, our remote support specialists can provide the expert guidance needed to finalize the diagnosis. This partnership ensures that your dashboard targets remain achievable, even when facing the most complex electrical or hydraulic failures. It's about providing the confidence that your fleet will keep moving, no matter what technical challenges arise.
Next Steps: Building Your 2026 Fleet Strategy
Refining your maintenance strategy starts with a clear-eyed audit of your current data. Ask yourself: what information is missing from your quarterly reviews? If you cannot currently track the diagnostic time versus the active repair time for your heavy assets, your dashboard is incomplete. We recommend a 30-day challenge: select one new KPI, such as the ratio of emergency to scheduled work, and track it exclusively using data pulled from a Jaltest kit. This focused approach allows you to see the immediate impact of technical precision on your operational efficiency.
The transition to a predictive, data-driven shop doesn't happen overnight, but it does require a decisive first step. You can equip your shop with the Jaltest OHW Kit today to begin capturing the granular data your fleet requires. By combining engineering-grade tools with a commitment to continuous improvement, you'll build a maintenance department that isn't just a cost center, but a driver of organizational stability and growth.
Elevating Fleet Performance through Diagnostic Accuracy
Mastering your fleet's operational stability requires more than just gathering data; it requires the technical precision to act on it. By implementing a diagnostic-driven equipment maintenance KPI dashboard, you move beyond guesswork and manual logs. You've seen how tracking metrics like MTTR and OEE can transform your shop's efficiency and how integrating real-time ECU data eliminates the 'Black Box' problem. This disciplined approach ensures that every maintenance decision is backed by engineering-grade insights rather than administrative estimates.
Mechnician is an authorized Jaltest dealer dedicated to providing the infrastructure your fleet needs to thrive. We include remote diagnostic support to help you meet your MTTR goals and offer flexible financing for heavy equipment tools to ensure your shop stays competitive. This partnership allows you to focus on long-term growth while we provide the technical safety net for your diagnostic ecosystem. It's time to stop reacting to failures and start predicting them through proactive management.
Explore Jaltest Diagnostic Kits to Power Your Fleet Dashboard and take the first step toward a more stable, data-driven future. Your fleet deserves the reliability that only professional-grade diagnostics can provide.
Frequently Asked Questions
What is the most important maintenance KPI for heavy equipment?
Mean Time to Repair (MTTR) is often considered the most critical KPI because it directly measures your shop's diagnostic efficiency and mechanical speed. While overall uptime is important, MTTR identifies the specific technical bottlenecks in your repair process. Reducing this metric ensures that high-value assets return to the field faster, protecting your project timelines and revenue.
How do I calculate Mean Time to Repair (MTTR) for my fleet?
Calculate MTTR by dividing the total time spent on unplanned repairs by the number of repair incidents over a specific period. This calculation should include the time spent on initial diagnosis, active repair work, and final system testing. Tracking this formula within your equipment maintenance KPI dashboard allows you to see if delays are caused by technical complexity or parts availability.
Can I integrate Jaltest diagnostic data with my existing CMMS?
Yes, Jaltest diagnostic data can be integrated with most modern Computerized Maintenance Management Systems through the Jaltest GRP module. This allows you to synchronize fault code histories and diagnostic reports directly with your digital work orders. Automating this integration ensures your dashboard reflects real-time machine health without the risks associated with manual data entry.
How often should I review my maintenance KPI dashboard?
The frequency of your review should depend on your specific operational role. Shop managers should monitor the dashboard daily to manage active alerts and technician assignments. Fleet directors and executives typically review the data on a monthly or quarterly basis to identify long-term trends in reliability and to adjust maintenance budgets based on asset performance.
What is the difference between a maintenance dashboard and telematics?
Telematics systems focus on raw data collection, such as GPS location, engine hours, and fuel consumption. An equipment maintenance KPI dashboard functions as a higher-level analytical tool that combines telematics data with diagnostic logs and labor costs. While telematics shows you where a machine is, the dashboard provides the context needed to understand its operational health and financial impact.
How can I reduce unplanned downtime without hiring more technicians?
You can reduce downtime by providing your existing team with advanced diagnostic tools that accelerate the troubleshooting process. In-house ECU access allows technicians to identify root causes immediately, which increases their overall repair capacity. This proactive approach prevents minor sensor issues or fault codes from escalating into major mechanical failures that require extensive labor.
Is a KPI dashboard worth it for a small fleet of 5-10 machines?
A KPI dashboard is highly valuable for small fleets because the loss of a single machine represents a significant percentage of your total operational capacity. With fewer assets, you have a smaller margin for error regarding repair costs and downtime. Precise tracking helps you identify which machines are becoming 'lemons' and allows you to optimize your maintenance schedule for maximum stability.
What are the common mistakes when designing a maintenance dashboard?
The most frequent mistake is 'dashboard fatigue', which occurs when you track too many irrelevant metrics that obscure critical alerts. Another common error is relying solely on administrative data, such as parts costs, while ignoring deep ECU diagnostic information. Without technical data, the dashboard cannot provide the predictive insights needed to prevent future failures or improve repair efficiency.



Dejar un comentario